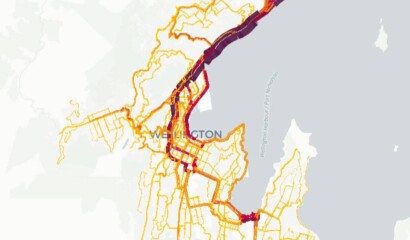
Use these interactive maps for Wellington and Porirua to see forecasted corridor changes, making regional travel patterns clear for data-driven decisions.
AIMSUN Next is a multi-resolution modelling platform that simulates mobility in networks of all sizes. The Wellington Transport Analytics Unit operate and maintain AIMSUN models of Wellington City, Porirua City and Hutt City.
These models focus on representing traffic demand, using the AIMSUN Hybrid structure whereby large areas can be modelled with mesoscopic simulation, together with added levels of detail within areas such as Wellington CBD where microscopic simulation is required.
Wellington Strategic Transport Model (WTSM) is a 4-stage demand model that is the central tool for demanding forecasting.
WTSM is calibrated to represent an average March weekday. The 24-h day is split into 4 periods:
Walking and cycling data are only available as a 24-h aggregate (daily total).
If you want access to the Unit’s modelling outputs such as maps or visualisations, please get in touch with us on wtau@gw.govt.nz.
The maps present flow (vehicles) and congestion (density, measured in vehicles per kilometer) during peak hours. We can add more layers to show other model results, such as free flow speeds and delays.
The legend for congestion (density) corresponds to the level of service table below. Higher density indicates worse level of service and longer delays. Sections with level of services between A and D experience minor to moderate delays, while those between E and F typically experience significant delays.
| Level of Service | Density (Vehicles / Kilometre) |
|---|---|
| A | 19 |
| B | 32 |
| C | 48 |
| D | 68 |
| E | 108 |
| F | >108 |
Through the visualisation we make WTSM data available at two geospatial levels: WTSM-Zones and Statistical Area 2 (SA2).
WTSM-Zones are smaller and have a higher geospatial resolution.
SA2 is aggregated from the WTSM-Zones and aligns largely with suburb level.
The maps present demand by orign and destination in different modes, including walking, cycling, rail, bus, light vehicles, and heavy commercial vehicles.
Besides that, we also show demand by trip purpose:
At the top left are the main interaction selectors:
|
Layers – Interact with the different layers set up in the visual |
|
|
Filters – filtering the data, each data-set is filtered individually |
|
|
Interactions – prosets for Tooltips, Geocoder, Brush and Coordinates display |
|
|
Base Map – presets for the basemap |
At the top right are display options for the entire visualisation:
| Show Info – general information as added by the creator of the map | |
| 3D – toggle between 2d and 3d view | |
| Draw on map | |
| Show legend |
Map layers can be toggled on or off by clicking the eye-icon symbol.
![]()
The visual used for HAM models outputs is based on the latest version of Vista, which features a slightly different interaction view. However, the overall functionality remains similar. More information is available here: Getting Started with a Shared Map
Of course! We can use Vista for other projects. We extract data from the Aimsun model, integrate it with geospatial information, and upload the data (in JSON, GeoJSON or CSV format) to Vista for visualisation. We can use this tool for any projects as long as they contain geospatial data.
Yes, we also use ArcGIS Online for mapping visualisation, and PowerBI for trend analysis and data visualisation. While ArcGIS Online mapping layers are currently used internally, we’ve published a PowerBI dashboard on our website Traffic Data Portal.
 |
 |
 |
We provide documentation relating to all model updates so that interested parties can understand how the models have evolved through time. Let's have a look!